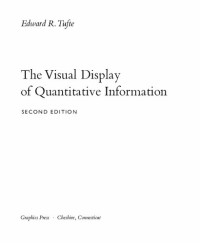
The Visual Display of Quantitative Information (with selectable text)
Edward R. Tufte
The classic book on statistical graphics, charts, tables. Theory and practice in the design of data graphics, 250 illustrations of the best (and a few of the worst) statistical graphics, with detailed analysis of how to display data for precise, effective, quick analysis. Design of the high-resolution displays, small multiples. Editing and improving graphics. The data-ink ratio. Time-series, relational graphics, data maps, multivariate designs. Detection of graphical deception: design variation vs. data variation. Sources of deception. Aesthetics and data graphical displays.
This is the second edition of The Visual Display of Quantitative Information. Recently published, this new edition provides excellent color reproductions of the many graphics of William Playfair, adds color to other images, and includes all the changes and corrections accumulated during 17 printings of the first edition.
This is the second edition of The Visual Display of Quantitative Information. Recently published, this new edition provides excellent color reproductions of the many graphics of William Playfair, adds color to other images, and includes all the changes and corrections accumulated during 17 printings of the first edition.
Категории:
Год:
2001
Издание:
2
Издательство:
Graphics Press
Язык:
english
Страницы:
200
ISBN 10:
0961392142
ISBN 13:
9780961392147
Файл:
PDF, 64.60 MB
IPFS:
,
english, 2001
 Amazon
  Barnes & Noble
  Bookshop.org
Хотите добавить книжный магазин? Свяжитесь с нами по support@z-lib.do
 Конвертируйте файлы
 Больше результатов поиска
 Другие преимущества

![黄慧敏 [未知] — 最简单的图形与最复杂的信息:如何有效建立你的视觉思维](https://s3proxy.cdn-zlib.se/covers200/collections/userbooks/4198f74294f8fd7b37a784ef4e1e750ebf9eb00060e089c06a22f4d498cd7758.jpg)


Ключевые слова
Связанные Подборки